Postcode district
EPC ratings in PE15
PE15 in Fenland has 10,894 properties with EPC certificates. The average rating is C, above the Fenland average. Browse sectors below or search for a specific address to view detailed property data. The area is predominantly house (61%). The most frequently recommended improvement is solar photovoltaic panels, 2.5 kwp.
Use these statistics: copy a summary, citation, chart or CSVEPC distribution
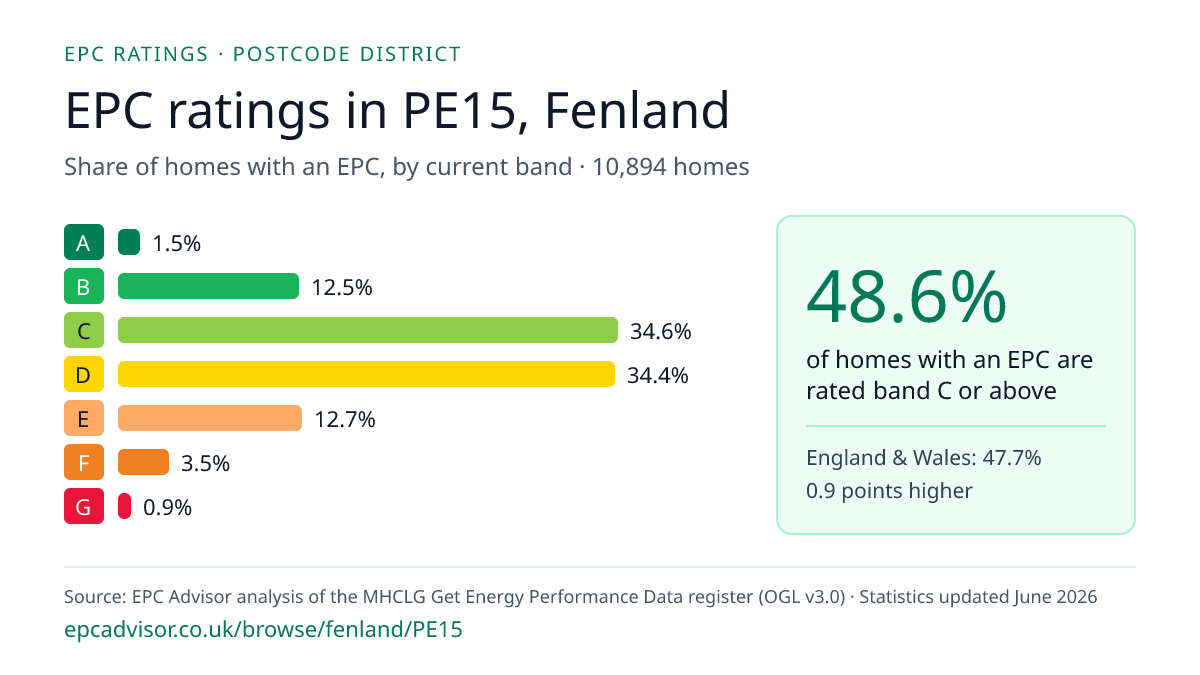
Percentage of properties in each EPC band across PE15.
Property type mix
Distribution of property types (houses, flats, bungalows) within PE15.
In PE15, the most common EPC-rated properties are house (around 61%) and bungalow (around 29%). This mix shapes how easy it is for local homes to improve their EPC ratings.
Top recommendations
Improvements most often recommended in this district.
- 1
Solar photovoltaic panels, 2.5 kWp
12042 occurrences
- 2
Solar water heating
11353 occurrences
- 3
Low energy lighting for all fixed outlets
6288 occurrences
- 4
Floor insulation (solid floor)
4503 occurrences
- 5
Replace boiler with new condensing boiler
3733 occurrences
Check a specific property
Enter your postcode to view an EPC report
Pick your address to see live EPC data and improvement recommendations.
Check first. Book only if needed.
Book an EPC assessment in Fenland (PE15)
Check whether your property already has a valid EPC, then arrange an accredited domestic assessment only if you need one.
For journalists, researchers and local groups
Use these statistics
Free to reuse with a link to this page. Figures cover homes with an EPC on the official register, counted by their latest certificate. Homes that have never had an EPC are not included, so the figures describe certified homes, not every home in PE15, Fenland.
Summary
In postcode district PE15 (Fenland), 48.6% of homes with an EPC are rated band C or above, based on the latest certificate for 10,894 homes on the official register (statistics updated June 2026). That is 0.9 percentage points above the England and Wales figure of 47.7%.
Citation
EPC Advisor (2026). EPC ratings in PE15, Fenland. Statistics updated June 2026. Analysis of the MHCLG Get Energy Performance Data register (Open Government Licence v3.0). https://epcadvisor.co.uk/browse/fenland/PE15
- Band C or above:
- a current rating of A, B or C.
- Homes counted:
- 10,894
- Statistics updated:
- June 2026
- Source:
- The MHCLG Get Energy Performance Data register, published under the Open Government Licence v3.0. How we calculate these figures · All EPC data downloads