Open data
EPC statistics and open data
Free statistics on Energy Performance Certificates in England and Wales, from council level down to postcode sector. Everything here is free to reuse with a link to the page you took it from.
Latest release · published 2 June 2026
EPC Postcode Lottery: Best & Worst Areas, England & Wales
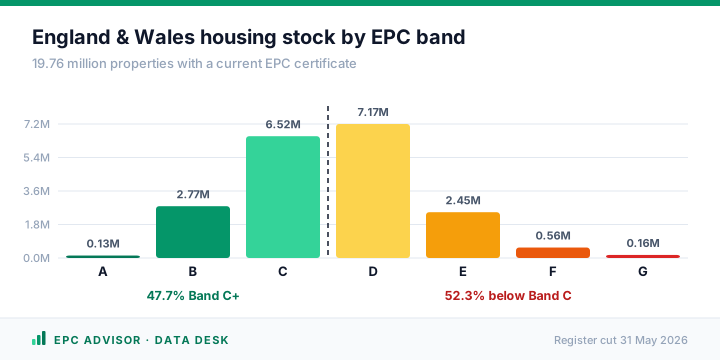
29,162,710 certificates covering 19,762,261 properties, from the register cut dated 31 May 2026.
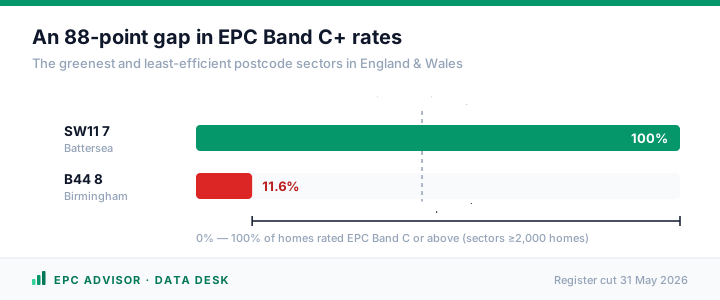
- An 88.4-point gap in Band C+ rate between the greenest and least-efficient postcode sectors: SW11 7 (Battersea) at 100% against B44 8 (Kingstanding, Birmingham) at 11.6%.
- 52.3% of homes with a current EPC are rated below band C.
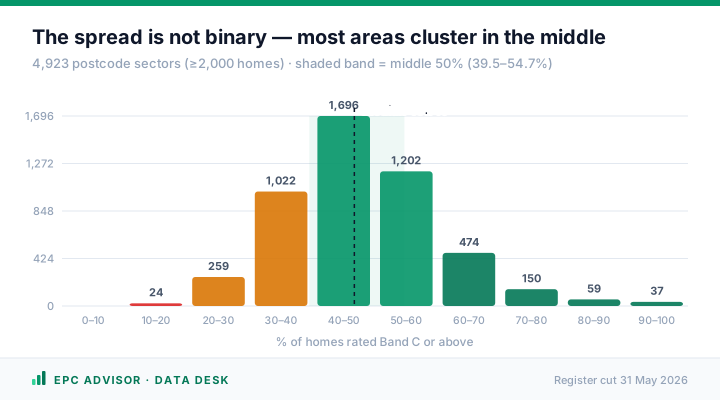
- The median postcode sector has 46.7% of homes at Band C or above; the middle half falls between 39.5% and 54.7%.
Downloads
Full league tables as CSV. The permanent link always points to the newest release; use the dated file when your figures need to stay fixed.
| Dataset | Areas | Included if | Dated file | Permanent link |
|---|---|---|---|---|
| Postcode sectors | 4,923 | 2,000+ homes with an EPC | 31 May 2026 (CSV) | epcadvisor.co.uk/data/epc-band-by-postcode-sector-latest.csv |
| Postcode districts | 1,848 | 3,000+ homes with an EPC | 31 May 2026 (CSV) | epcadvisor.co.uk/data/epc-band-by-postcode-district-latest.csv |
- sector / district
- The postcode sector (e.g. SW11 7) or district (e.g. SW11).
- local_authority, la_slug
- The council the area sits in, and its EPC Advisor URL slug.
- homes
- Homes with a current EPC, each counted once by its latest certificate.
- a to g
- How many of those homes are in each band.
- pct_band_c_plus
- Share of homes rated A, B or C, to one decimal place.
Find your area in the league table
Search the ranked postcode sectors and districts by postcode or council. Rank 1 has the highest share of homes at Band C or above; tied areas share a rank.
Charts you can reuse
Each chart carries its source and register date. Reuse them with a link to the analysis.
Statistics for every council and postcode district
Every council and postcode district page has a Use these statistics panel: a two-sentence summary and a citation to copy, a chart with the source printed on it, and a one-row CSV. Those figures refresh when the register data is updated, and each one shows the date it was last updated.
For journalists and researchers
How to cite
Please link to the page you took the figures from. For the league tables and charts on this page:
EPC Advisor (2026). EPC Postcode Lottery: Best & Worst Areas, England & Wales. Register cut 31 May 2026. https://epcadvisor.co.uk/insights/epc-postcode-lottery-england-wales
Area pages give their own ready-made citation in the Use these statistics panel.
What the figures cover
- Only homes that have had an EPC. The register mostly holds homes that were sold, let or built since 2008, so the figures describe certified homes, not every home.
- Each home is counted once, by its latest certificate.
- The league tables rank postcode sectors with at least 2,000 homes with an EPC and districts with at least 3,000. The most extreme ranks are sensitive to that threshold.
- Rates are rounded to one decimal place, so 100% means at least 99.95%.
- Source data: the MHCLG Get Energy Performance Data register, published under the Open Government Licence v3.0. Our derived tables are free to reuse with attribution to EPC Advisor.
Full method: methodology and about our data. Questions about the data? Contact us.